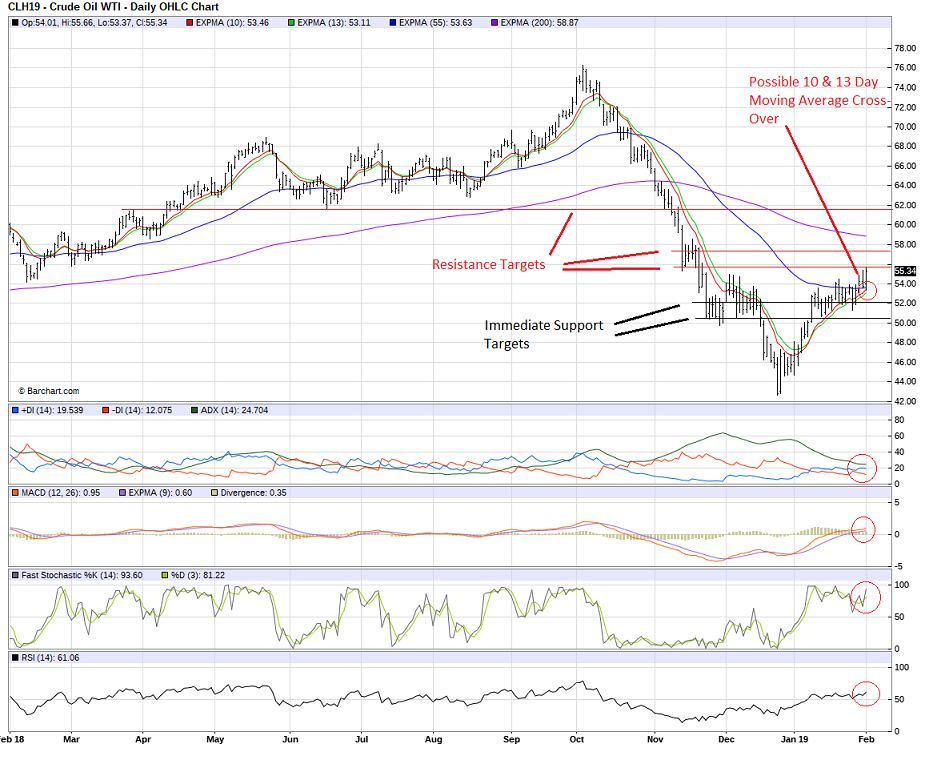
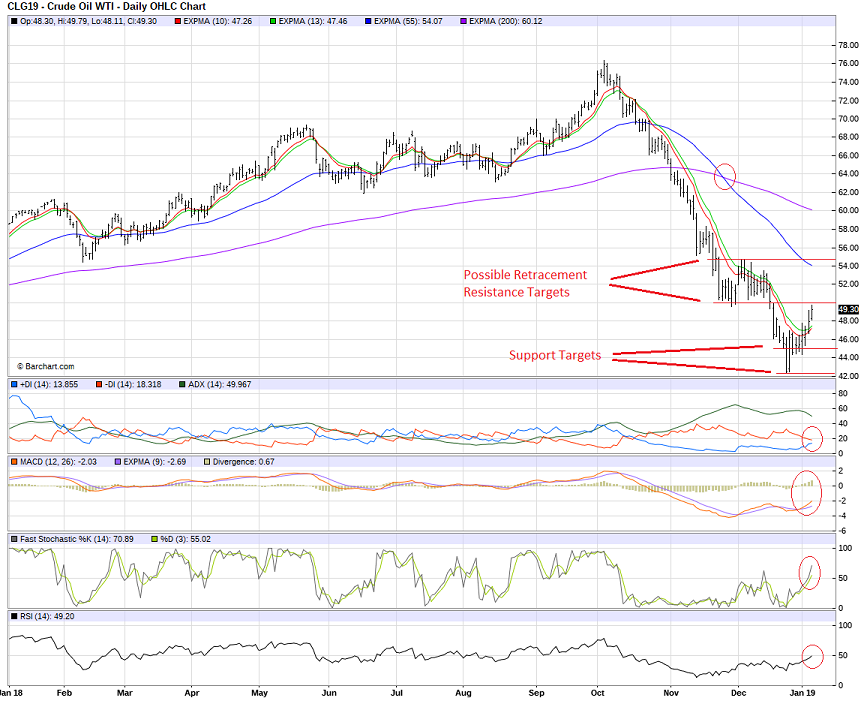
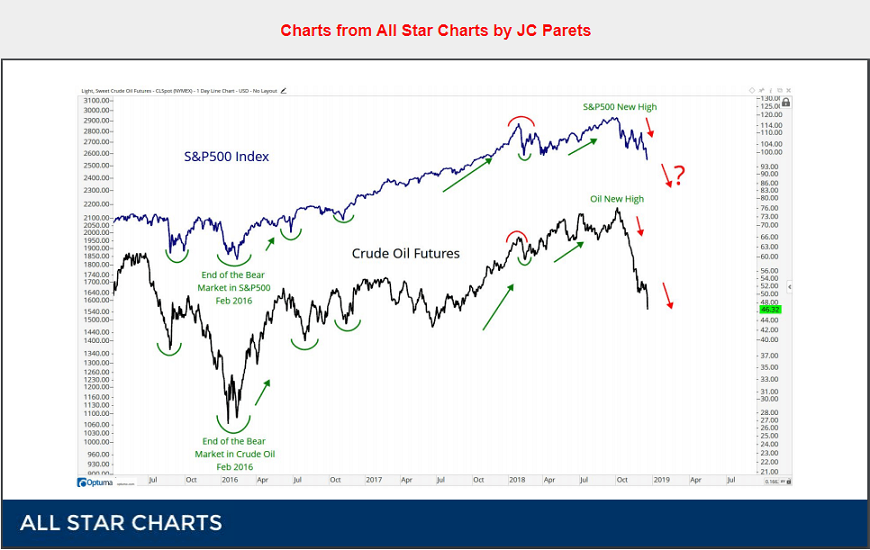
Crude oil had a significant correction after reaching near 77.00 to near 42.00. Even talks of cutting production from OPEC and Saudi Arabia looking to go IPO on their sovereign oil funds did not help crude oil at all. Crude oil seems to follow the same direction as the stock market correction. (See chart below from JC Parets). If that statement is true, then most likely crude oil will see more downside pressure ahead. Based on a correction down in global stock markets which has been pressuring our U.S. markets, may lead crude oil lower even still. However, for now we may see a retracement correction back up with renewed talks from OPEC on cutting production and from short covering. On a longer-term basis, look for renewed selling momentum to increase after the retracement especially IF the stock markets starts to head down.
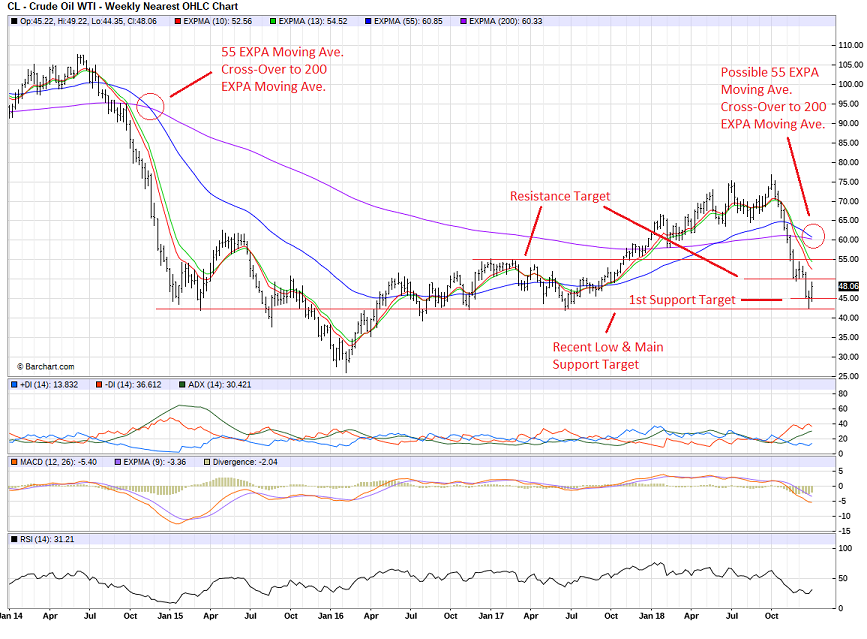
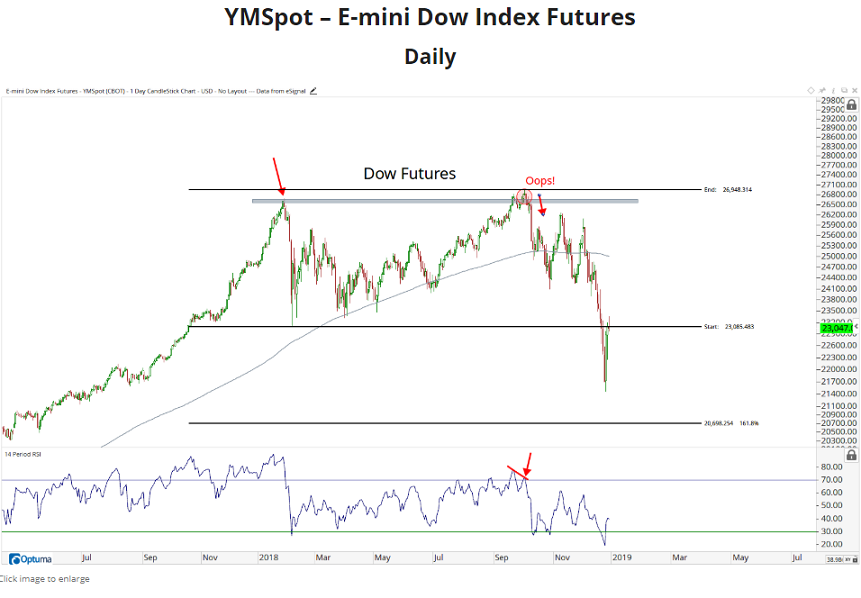
As you can see from All Start Chart by JC Parets comparison of crude with S&P 500 Index, we may still see pressure to the downside until the stock markets level off. In this case we should still test next two targets of Mini Dow Jones cash near 21,500 then to 19,200, but for now we are seeing a corrective retracement. Major support in crude oil is at near 42.00. On the technical side, you can see that 55 EXPA (Exponential Moving Average) is moving toward crossing below the 200 EXPA. If it crosses over then we are seeing a strong longer-term downside potential. If the support of 42.00 holds, in my opinion, we may see a bounce back up due to short covering. However, I think it's better to be cautious for the downside at this moment.
The information contained in this article is the opinion of the writer or was obtained from sources cited within the commentary. The impact on market prices due to seasonal or market cycles and current news events may already be reflected in market prices
Chart Posted on January 7th, 2019
From All Star Charts by JC Parets. All Star Charts research platform provides technical analysis commentary across all asset classes to investors worldwide.
www.allstarcharts.com
From All Star Charts by JC Parets. All Star Charts research platform provides technical analysis commentary across all asset classes to investors worldwide.
www.allstarcharts.com
HYPOTHETICAL PERFORMANCE RESULTS HAVE MANY INHERENT LIMITATIONS, SOME OF WHICH ARE DESCRIBED ABOVE. NO REPRESENTATION IS BEING MADE THAT ANY ACCOUNT WILL OR IS LIKELY TO ACHIEVE PROFITS OR LOSSES SIMILAR TO THOSE SHOWN. IN FACT, THERE ARE FREQUENTLY SHARP DIFFERENCES BETWEEN HYPOTHETICAL PERFORMANCE RESULTS AND THE ACTUAL RESULTS SUBSEQUENTLY ACHIEVED BY ANY PARTICULAR TRADING PROGRAM. ONE OF THE LIMITATIONS OF HYPOTHETICAL PERFORMANCE RESULTS IS THAT THEY ARE GENERALLY PREPARED WITH THE BENEFIT OF HINDSIGHT. IN ADDITION, HYPOTHETICAL TRADING DOES NOT INVOLVE FINANCIAL RISK, AND NO HYPOTHETICAL TRADING RECORD CAN COMPLETELY ACCOUNT FOR THE IMPACT OF FINANCIAL RISK IN ACTUAL TRADING. FOR EXAMPLE, THE ABILITY TO WITHSTAND LOSSES OR TO ADHERE TO A PARTICULAR TRADING PROGRAM IN SPITE OF TRADING LOSSES ARE MATERIAL POINTS WHICH CAN ALSO ADVERSELY AFFECT ACTUAL TRADING RESULTS. THERE ARE NUMEROUS OTHER FACTORS RELATED TO THE MARKETS IN GENERAL OR TO THE IMPLEMENTATION OF ANY SPECIFIC TRADING PROGRAM WHICH CANNOT BE FULLY ACCOUNTED FOR IN THE PREPARATION OF HYPOTHETICAL PERFORMANCE RESULTS AND ALL OF WHICH CAN ADVERSELY AFFECT ACTUAL TRADING RESULTS.